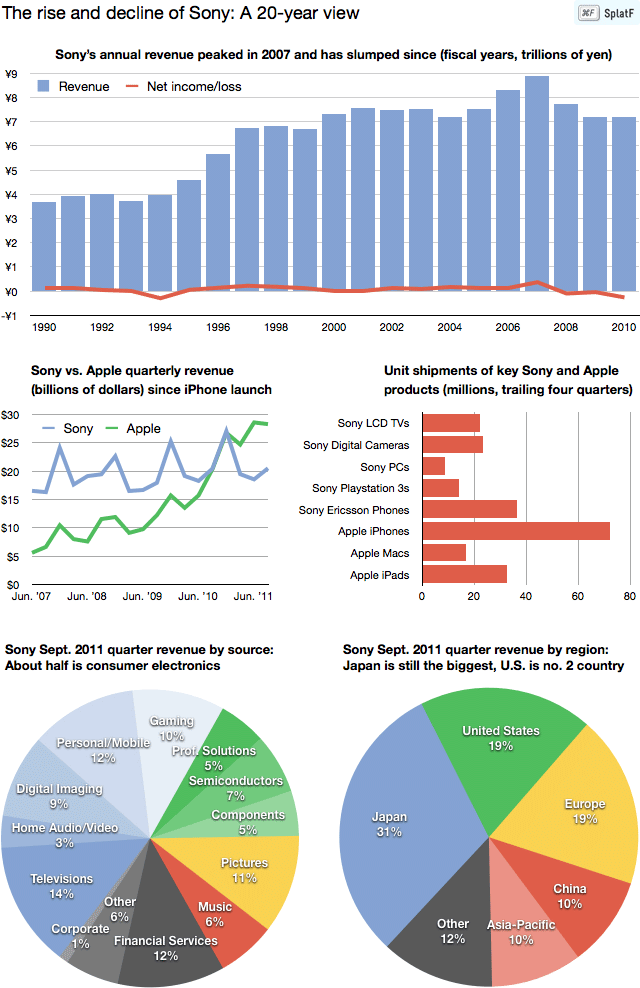
The rise and decline of Sony: A 20-year view
Sony lost $350 million last quarter on more than $20 billion of sales, and warned last week that full-year losses would total more than $1 billion — its fourth straight year of losses.
Sony blamed last quarter’s sales decline on weak LCD TV sales and foreign currency exchange rates. But in reality, the company’s bigger troubles started years ago. I’ll elaborate on that later, in another post.
One of the amazing things Sony does, however, is maintain a huge library of its financial data on its Investor Relations site. While most companies maintain spreadsheets of the last few quarters or years worth of financial results, Sony’s go back to 1960(!). There’s an incredible amount of information available, from its super-long-term financial history, to annual trends for hardware and software sales of its various videogame consoles.
For starters, here are a few charts I’ve put together, including Sony’s annual (fiscal year) sales and profits dating back to 1990, and a couple showing how Apple has blown past Sony in consumer electronics sales.

Follow-up: How does Sony make money? Life insurance!

Check out my new site: The New Consumer, a publication about how and why people spend their time and money.

